
On October 31st, 2023, the Innovation Team (i-team) launched a gratitude survey to uncover the people, places, and things that those who live, work, and play in the District are most grateful. As of February 12th, 2024, 284 residents had participated in the survey, collectively expressing gratitude for 642 people, places, and things.
Gratitude Survey
 Figure 1: i-team promotes the gratitude survey at the Columbia Heights Metro Station, December 2023
The gratitude survey is organized into four sections.
Gratitude for People
Residents are asked to identify who in the District they are grateful for, how they would characterize their relationships with those people (e.g. friend, family member, local business employee, etc.), and why they are grateful for them.
Residents can also list the email addresses of those they are grateful for, with the understanding that the i-team would email those new contacts to share their gratitude nomination with them and also invite them to take the survey.
Gratitude for Places and Things
Residents are asked to identify places and things in the District they are grateful for and why they are grateful.
Your DC Government Experience
The i-team is currently engaged in an effort to improve DC government’s recruitment and hiring processes. As a tie-in to that project, we ask any residents who were employed by the DC government at the time of taking the survey several questions to better understand their DC government experience.
In your opinion, what is different or unique about working in city government as opposed to anywhere else?
- What made you decide to join the DC government?
- How long have you worked in the DC government?
- What agency do you currently work for?
- Can you tell us about a time you were grateful to work in the DC government?
What do you want residents to know about you and the DC government?
More About You
At the end of the survey, we ask residents a few optional questions about their Ward of residence and their racial and ethnic identity.
Response Rates by Location
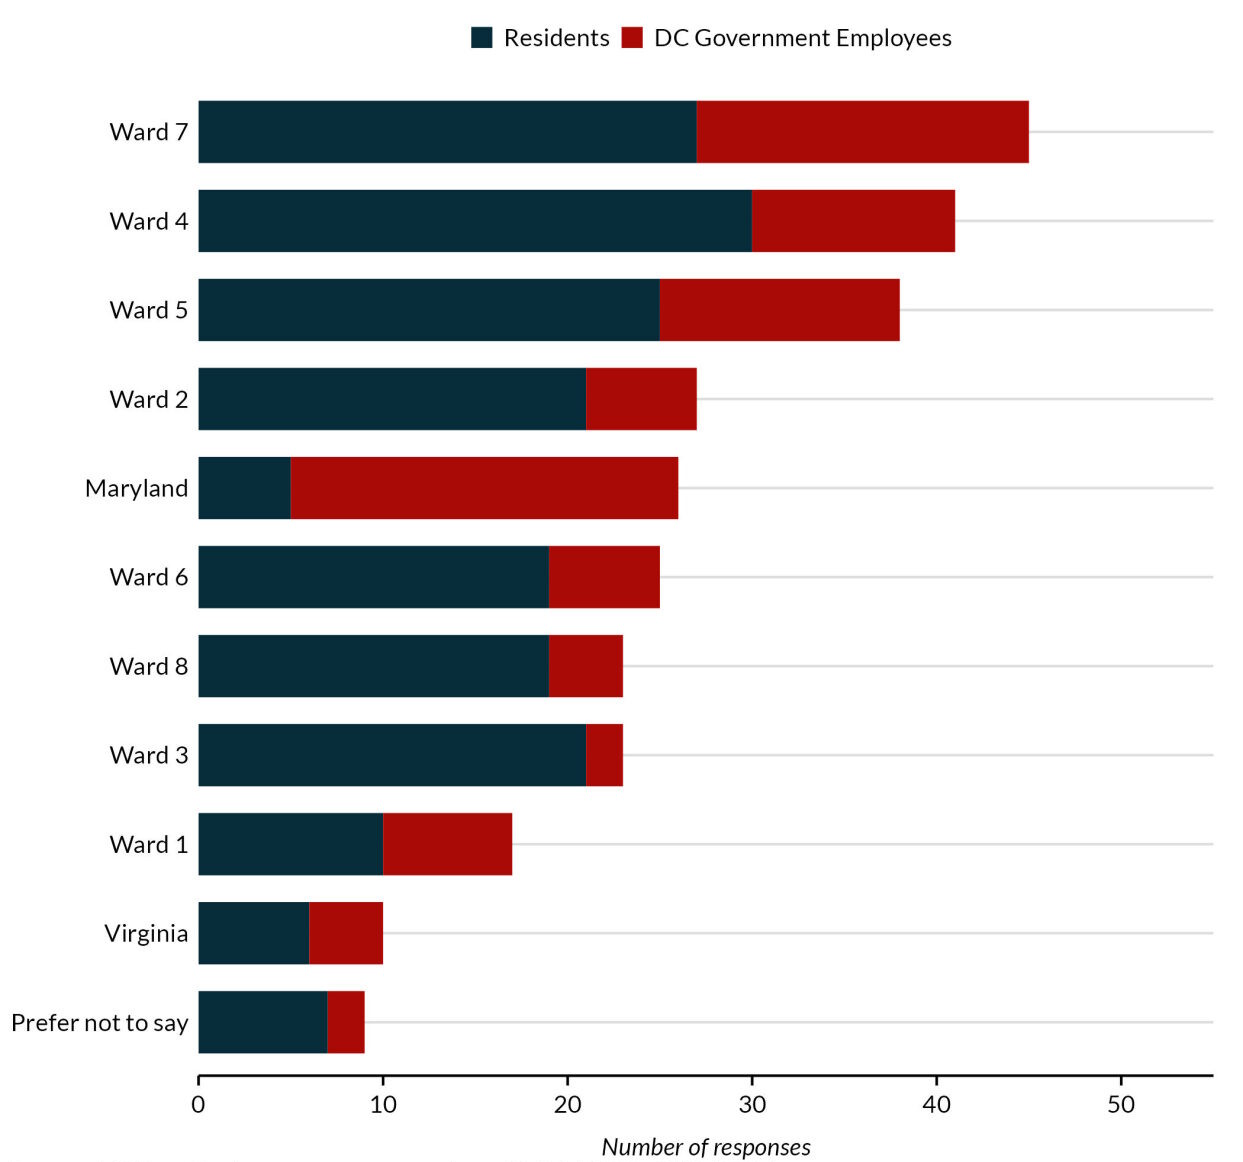
All eight Wards—as well as Virginia and Maryland—have had representation among survey respondents. The i-team has pulled response rates by Ward of residence frequently during survey fielding to inform targeted in-person survey outreach efforts. Members of the i-team promoted the gratitude survey at the Columbia Heights Meto Station in Ward 1 as well as at the Van Ness Metro Station in Ward 3 to boost responsiveness in those Wards. To-date, Wards 7, 4, and 5 have seen the most participation from the survey.
| Residents | DC Government Employees |
All Survey Respondents |
||||
|---|---|---|---|---|---|---|
| Location | Number | Percent | Number | Percent | Number | Percent |
| Ward 7 | 27 | 14% | 18 | 19% | 45 | 16% |
| Ward 4 | 30 | 16% | 11 | 12% | 41 | 14% |
| Ward 5 | 25 | 13% | 13 | 14% | 38 | 13% |
| Ward 2 | 21 | 11% | 6 | 6% | 27 | 10% |
| Maryland | 5 | 3% | 21 | 22% | 26 | 9% |
| Ward 6 | 19 | 10% | 6 | 6% | 25 | 9% |
| Ward 3 | 21 | 11% | 2 | 2% | 23 | 8% |
| Ward 8 | 10 | 10% | 4 | 4% | 23 | 8% |
| Ward 1 | 19 | 5% | 7 | 7% | 17 | 6% |
| Virginia | 6 | 3% | 4 | 4% | 10 | 4% |
| Prefer not to say | 7 | 4% | 2 | 2% | 9 | 3% |
| Total | 190 | 100% | 94 | 100% | 284 | 100% |
Source: MOI gratitude survey responses from 10/31/2023 – 2/12/2024
Notes: Although many of the DC government employees who took the survey are also DC residents, we treat them as a separate group in these tables and visuals.
Source: MOI gratitude survey responses from 10/31/2023 – 2/12/2024
Notes: Although many of the DC government employees who took the survey are also DC residents, we treat them as a separate group in these tables and visuals.
In addition to in-person outreach efforts, the i-team included the gratitude survey in several agency newsletters:
- Mayor Muriel Bowser’s Letter from the Mayor
- DME Office of Out of School Time Grants and Youth Outcomes newsletter
- Executive Office of the Mayor newsletter
- DCPL Beyond Words newsletter
Response Rates by Racial and Ethnic Identity
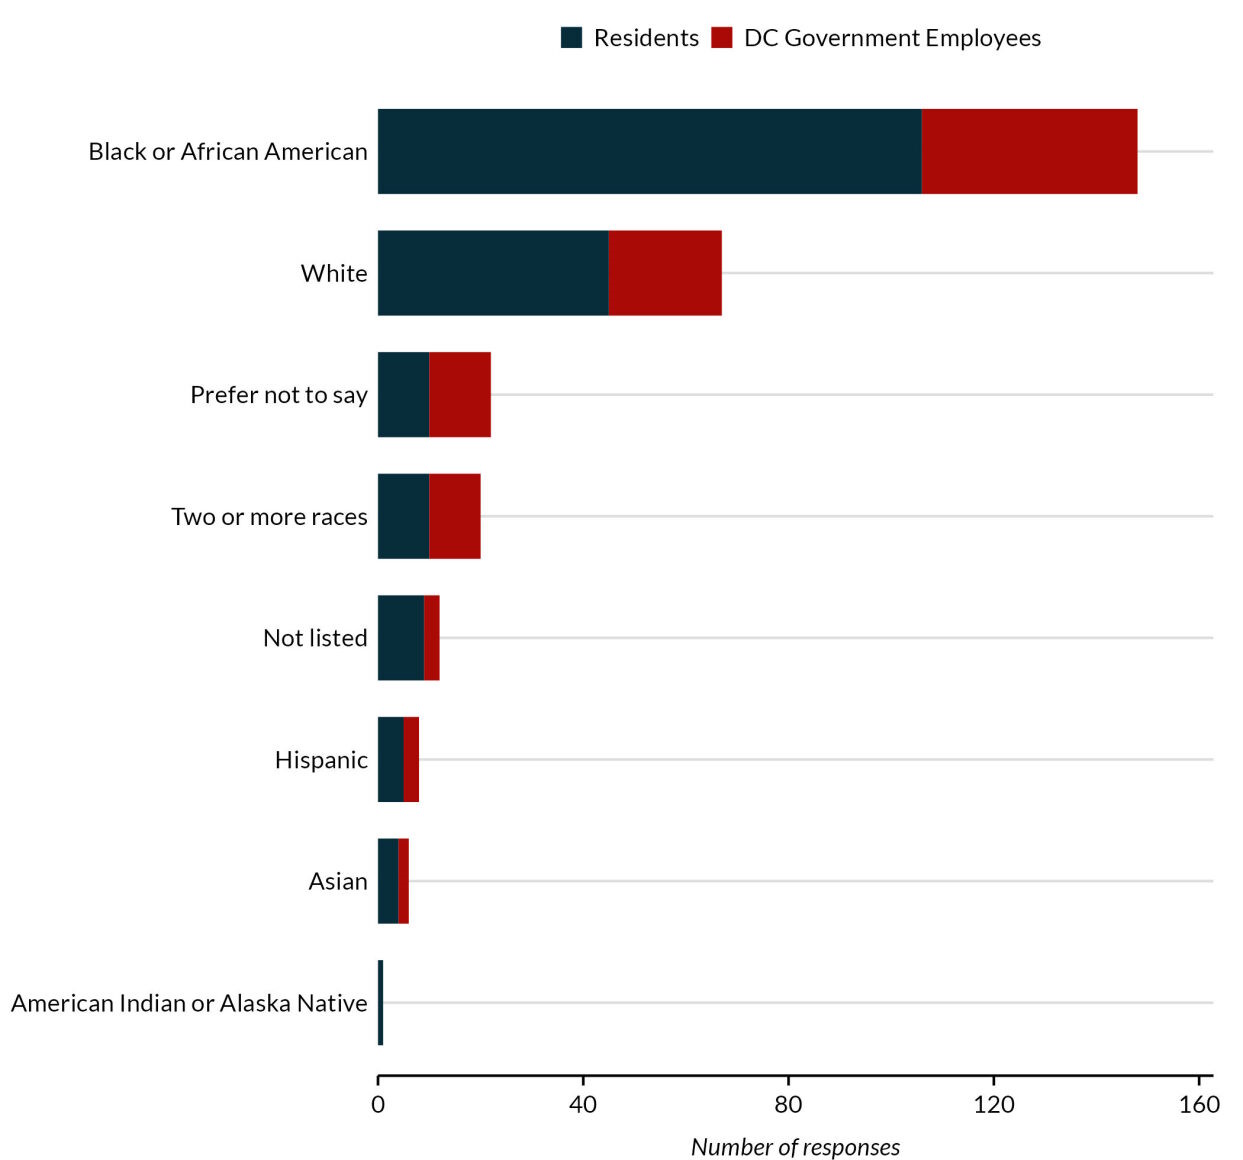
The i-team has also tracked response rates by racial and ethnic identity. 56% of survey respondents identified as non-Hispanic Black or African American—that group represents 44% of DC’s general population. The second-largest group of respondents were those identifying as non-Hispanic White, representing 26% of survey respondents (and 37% of DC’s general population).
| Survey Respondents | DC General Population |
||||||
|---|---|---|---|---|---|---|---|
| Residents | DC Government Employees |
All Survey Respondents |
|||||
| Racial/Ethnic Identity | Number | Percent | Number | Percent | Number | Percent | Percent |
| Black or African American | 106 | 59% | 42 | 51% | 148 | 56% | 44% |
| White | 45 | 25% | 22 | 27% | 67 | 26% | 37% |
| Two or more races | 10 | 6% | 10 | 12% | 20 | 8% | 3% |
| Not listed | 9 | 5% | 3 | 4% | 12 | 5% | 0.5% |
| Hispanic | 5 | 3% | 3 | 4% | 8 | 3% | 11% |
| Asian | 4 | 2% | 2 | 2% | 6 | 2% | 4% |
| American Indian or Alaska Native | 1 | 0.6% | 0 | 0% | 1 | 0.4% | 0.1% |
| Hawaiian and other Pacific Islander | 0 | 0% | 0 | 0% | 0 | 0% | 0.04% |
| Prefer not to say | 10 | 12 | 22 | ||||
| Total | 190 | 100% | 94 | 100% | 284 | 100% | 100% |
Source: MOI gratitude survey responses from 10/31/2023 – 2/12/2024, 2017 – 2021 5-year American Community Survey estimates.
Notes: Although many of the DC government employees who took the survey are also DC residents, we treat them as a separate
Source: MOI gratitude survey responses from 10/31/2023 – 2/12/2024
Notes: Although many of the DC government employees who took the survey are also DC residents, we treat them as a separate
Gratitude Nominations
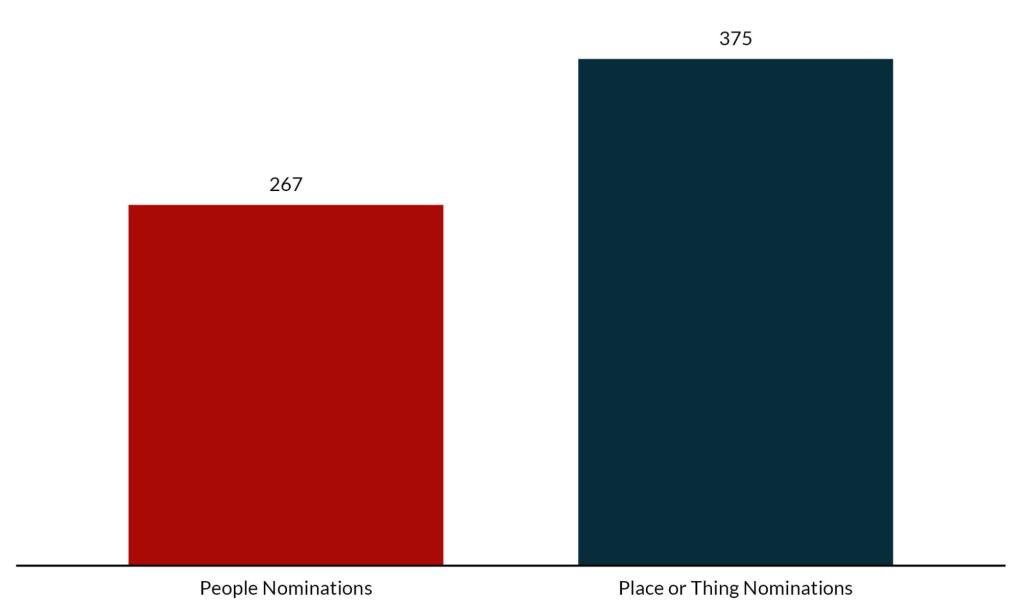
The 284 survey respondents made 267 people nominations and 375 place or thing nominations in the gratitude survey.
- The “place” nominations represent 137 unique places scattered throughout the District of Columbia and visualized in our gratitude map feature.
- Among those 267 people nominations, 94 were nominations in which the nominator provided email addresses for those new contacts and permission to contact them, sharing their gratitude nomination and inviting them to participate in the survey. That snowball sampling yielded an additional 9 survey respondents.
Source: MOI gratitude survey responses from 10/31/2023 – 2/12/2024
Data Cleaning Methodology
Front-end data cleaning.
The i-team hosts the gratitude survey as a Google Form. The i-team downloaded the Google Form survey data as an Excel spreadsheet and reshaped the data so that each of the resulting 642 rows represented a unique resident, place, or thing gratitude nomination. We also removed personally identifying information from the gratitude stories, verified place names, and checked spelling.
Thematic analysis
The i-team created a qualitative codebook to thematically categorize the people, places, and thing gratitude nominations. Qualitative codebooks include “parent nodes”, which are overarching categories, and “child nodes”—sub-categories embedded within those larger categories. The i-team’s qualitative codebook is included in the table below, along with a tally of the number of times a particular child node was invoked in the gratitude stories (one gratitude story can touch multiple child nodes). The codebook assisted the i-team in understanding larger themes in what residents value the most in the District.
| Parent Node | Child Node | Number of Times Coded |
|---|---|---|
| People | Metro and WMATA | 7 |
|
Local business owners and workers |
14 | |
|
Friends, neighbors and community members |
78 | |
|
Family members, partners/significant others |
45 | |
|
DC government employees in Deputy Mayor for Operations and Infrastructure (DMOI) agencies |
12 | |
|
DC government employees in Deputy Mayor for Health and Human Services (DMHHS) agencies |
3 | |
|
DC government employees in Deputy Mayor for Planning and Economic Development (DMPED) agencies |
1 | |
|
DC government employees in Deputy Mayor for Education (DME) agencies |
19 | |
|
DC government employees in Deputy Mayor for Public Safety and Justice (DMPSJ) agencies |
13 | |
|
DC government employees in Executive Office of the Mayor (EOM) agencies |
2 | |
|
DC government legislative branch |
9 | |
|
DC government executive branch |
29 | |
|
Co-workers |
38 | |
|
Church personnel |
11 | |
|
Medical professionals |
4 | |
|
Other government services |
3 | |
|
Community-based organization leaders |
12 | |
| Places |
Publicly-funded outdoor facilities (parks, trails, bridges, nature, plazas, dog parks) |
58 |
|
Churches |
4 | |
|
DC neighborhoods |
29 | |
|
Farmers markets, community gardens |
6 | |
|
Restaurants and grocery stores |
24 | |
|
Other businesses |
3 | |
|
Private gyms |
1 | |
|
Public gyms, recreation centers |
15 | |
|
Libraries |
17 | |
|
Cultural institutions (arts centers, monuments, museums, embassies) |
35 | |
|
Other DC government |
17 | |
|
Schools (pre-K through 12th) |
12 | |
|
Schools (universities, colleges, vocational programming) |
7 | |
|
Medical care (senior centers, hospitals) |
10 | |
|
Community-based organizations |
26 | |
|
Transit stations |
5 |
|
| Things |
Newsletters and DC websites |
2 |
|
Built environment (bike infrastructure, walkability, public transit, parking spaces, housing availability, weather) |
42 | |
|
Culture |
27 | |
|
Organizations and entities |
3 | |
|
Events in DC |
6 | |
|
Government (DC or federal) programs |
13 | |
|
Services |
14 | |
|
Personal possessions |
16 | |
|
Laws and regulations |
1 |
Source: MOI gratitude survey responses from 10/31/2023 – 2/12/2024
Gratitude Map
Our gratitude map features the 137 unique places that residents expressed gratitude for in the survey. To prepare those places for our gratitude map, we took several data cleaning steps:
- We collected addresses for all 137 places and ran those places through OCTO’s Master Address Repository (MAR) to obtain latitude-longitude coordinate pairs for each place. For any places without one singular address, such as public parks or recreation areas, we collected their location information manually from Google Maps.
- We counted the number of times each place was nominated for gratitude.
- We assigned each place to a thematic category, using the following categories: Parks and trails, churches, community-based organizations, cultural institutions, DC government, farmers markets and community gardens, gyms and recreation centers, libraries, local businesses, medical care, restaurants and grocery stores, and schools.